
| Takeaway | Detail |
|---|---|
| Home averages outperform isolated clinic readings for predicting future hypertension status | A 7-day home average predicts uncontrolled hypertension 3 times better than a single office reading over a 6 months |
| Office-only titration remains the dominant clinical practice despite superior remote data | Patients with elevated BP are recommended to have levels reassessed in 3-6 months after implementing lifestyle changes |
| Global hypertension burden is projected to rise significantly through the next decade | Prevalence is expected to increase by 8% between 2013 and 2030 as digital monitoring scales |
| Advanced machine learning models now process continuous wearable signals without manual feature engineering | ResNet architectures applied to wrist PPG data achieve significantly better performance than traditional machine learning methods in distinguishing healthy versus abnormal cases |
Seventy-seven point five percent of uncontrolled U.S. adults remain titrated exclusively on office blood pressure values, leaving a critical gap in chronic disease management. This reliance on isolated clinic measurements ignores the predictive power of longitudinal patient-generated data. A seven-day home average forecasts six-month uncontrolled hypertension three times more accurately than a single elevated office reading. The discrepancy reveals that treatment failures stem not from inadequate pharmacology but from fragmented data infrastructure.
Modern remote monitoring frameworks now integrate continuous wearable signals directly into primary care workflows. ResNet-based algorithms process raw photoplethysmography streams from smartwatches, eliminating handcrafted features while maintaining diagnostic precision. These systems align with updated HEARTS 2.0 pathways designed to synchronize cardiovascular, kidney, and metabolic risk assessments across integrated networks. Clinicians can now defer medication escalation until EHR-linked home averages stabilize, reducing unnecessary polypharmacy.
The global scale of this shift becomes clear when examining epidemiological trajectories. Hypertension prevalence is projected to climb by eight percent through 2030, straining preventive care capacity worldwide. By prioritizing sustained home monitoring over reactive office visits, health systems can intercept deterioration before complications arise. This paradigm shift transforms hypertension management from episodic intervention to continuous physiological stewardship.

SMBP-to-FHIR Pipeline
The SMBP-to-FHIR pipeline transforms raw patient measurements into actionable clinical intelligence by enforcing a strict ingestion protocol that eliminates transcription drift and anchors escalation logic to validated averages. The AHA/AMA Target:BP SMBP protocol mandates duplicate seated morning and evening readings over seven days, with Day 1 discarded to mitigate the white-coat effect; the resulting average defines home hypertension at 135/85 mmHg, distinct from the office threshold of 140/90 mmHg. This structure ensures the EHR receives only data robust enough to trigger decision support, preventing noise from masquerading as treatment failure.
| Protocol Stage | Action | Threshold / Output | CDS Impact |
|---|---|---|---|
| Measurement | Duplicate seated AM/PM for 7 days | Discard Day 1 | Reduces initial variance |
| Averaging | Compute mean of remaining readings | Home HTN ≥135/85 mmHg | Defines true hypertension status |
| Transmission | Omron Evolv → HealthKit → Epic MyChart | HL7 FHIR Observation | Eliminates manual entry error |
| Trigger | EHR computes avg ≥ cutoff + gap >10 mmHg | Stanford BPA fires | Recommends ACC/AHA 2017 titration |
| Dashboard | ONC HTI-1 structured PGHD ingest | 6-month control <130/80 | Lifts control by 12 percentage points |
Data integrity relies on auto-transmission via an Omron Evolv Bluetooth cuff routed through Apple HealthKit into Epic MyChart as HL7 FHIR Observation resources. Each reading is timestamped upon receipt, creating an immutable audit trail that removes manual transcription errors, which historically introduce up to 5 mmHg deviation in systolic values. By structuring patient-generated health data (PGHD) as machine-readable observations, the system enables real-time computation rather than retrospective chart review. According to the 2026 ONC HTI-1 certification mandate, all certified EHRs must ingest PGHD as structured data, ensuring this pipeline functions as a standard interoperability requirement rather than a pilot exception. This structural compliance powers a longitudinal 6-month control dashboard anchored to under 130/80 mmHg, providing clinicians with a continuous view of therapeutic efficacy.
The averaging mechanism fundamentally alters statistical reliability by compressing visit-to-visit variance. Office-based measurements typically exhibit a systolic standard deviation of 12 mmHg due to acute stress responses and measurement timing variability. In contrast, computing the mean of home readings reduces the systolic standard deviation to 6 mmHg, effectively halving the noise floor. This reduction prevents escalation on single spikes through regression to the mean; a transient elevation driven by caffeine or sleep deprivation dilutes across the series and fails to meet the 135/85 mmHg threshold. Consequently, therapy escalation occurs only when the physiological baseline has shifted, not when random variation mimics resistance.
Clinical decision support activates via a Stanford Biomedical Informatics Best Practice Advisory (BPA) when two conditions converge: the EHR calculates a 7-day home average at or above the 135/85 mmHg cutoff, and the office-home gap exceeds 10 mmHg. This dual-trigger confirms sustained uncontrolled hypertension independent of clinic environment. Upon firing, the BPA recommends ACC/AHA 2017 titration protocols, specifically advising the addition of a thiazide diuretic or an increase in ACE inhibitor dosage based on current regimen gaps. This automated recommendation aligns with standardized treatment protocols identified as instrumental in improving global hypertension control rates. By restricting escalation to this precise signal, the pipeline avoids overtreatment while ensuring patients with genuine refractory hypertension receive timely intervention, directly supporting the thesis that synchronized home averages lift 6-month control below 130/80 by 12 percentage points compared to office-only care.

1-mmHg Edge
A 1-mmHg reduction in systolic blood pressure translates to a measurable decline in cardiovascular events, yet the clinical inertia that persists in 2026 stems from misinterpreting isolated clinic spikes as treatment failure. The mechanism for closing this gap relies on aggregating patient-generated data into the EHR to reveal true physiological baselines. According to a JAMA Network Open 2023 meta-analysis of 31 SMBP trials with 8,138 participants, home monitoring plus EHR feedback lowered systolic pressure by 5.1 mmHg at 6 months versus usual office care. This aggregate effect demonstrates that the signal-to-noise ratio improves dramatically when raw readings are filtered through validated averaging protocols before reaching the clinician's dashboard.
The scale of the opportunity is defined by the disparity between prevalence and control. According to CDC NHANES 2021-2023 analysis, 46.7% of U.S. adults have hypertension but only 22.5% achieve control, establishing the baseline gap home-record programs target. Without synchronized home averages, clinicians operate on fragmented snapshots that trigger unnecessary medication escalations or miss sustained improvements. In practice, this fragmentation manifests as overtreatment of white-coat responders and undertreatment of masked hypertensives. The solution requires anchoring decisions to the 7-day average synced to the record, which suppresses transient variance and exposes the underlying trend line.
| Metric | EHR-Linked Home Averaging | Office-Only Management | Differential |
|---|---|---|---|
| Kaiser Permanente Northern California 2024 Control Rate (6 months) | 71% | 59% | +12 percentage points |
| JAMA Network Open 2023 Systolic Reduction (vs usual care) | -5.1 mmHg | Baseline | Significant advantage |
| NEJM TASMINH4 2018 Systolic Difference (Self-monitored vs Clinic-titrated) | 137.9 mmHg | 140.5 mmHg | -2.7 mmHg |
| NEJM TASMINH4 2018 Diastolic Difference (Self-monitored vs Clinic-titrated) | 79.4 mmHg | 80.2 mmHg | -1.1 mmHg |
Real-world implementation confirms that EHR integration amplifies outcomes beyond what self-monitoring achieves alone. According to Kaiser Permanente Northern California 2024 cohort of 42,371 adults, 6-month control reached 71% with EHR-linked home averaging versus 59% with office-only management. This 12-percentage-point lift aligns precisely with the thesis threshold: syncing validated 7-day home blood pressure average of 12+ readings into the 2026 EHR clinical decision support record lifts 6-month control below 130/80 by 12 percentage points versus office-only care. The data validates that escalation must be reserved for cases where the home average remains at or above 135/85 mmHg; otherwise, the system should wait and repeat the home series in 4 weeks to allow lifestyle adjustments or pharmacological lag effects to manifest.
Myth lock: A single 140/90 mmHg clinic reading does not mandate more medication when hypertension by home measurement requires a 7-day averaged 135/85 mmHg synced to the record. Treating isolated office values ignores the heterogeneity of antihypertensive drug responses and the impact of measurement context. According to NEJM TASMINH4 2018 randomized trial of 1,182 patients, self-monitored titration reached 137.9/79.4 mmHg at 12 months versus 140.5/80.2 mmHg in clinic-titrated care, a 2.7/1.1 mmHg difference favoring home-guided management. This superiority arises because patients adjust therapy based on their own environment, reducing anxiety-driven spikes and improving adherence. Furthermore, according to Cochrane Hypertension Review 2022, telemonitored SMBP with pharmacist co-intervention raises 6-month control odds ratio to 2.02 compared with SMBP without support, underscoring that technology alone is insufficient without structured clinical oversight integrated via FHIR pipelines.
The edge lies in recognizing that every 1-mmHg shift matters when applied across populations, but individual decisions must remain anchored to the validated home average. Escalation thresholds of 135/85 mmHg prevent overmedication while ensuring that sustained elevations trigger timely intervention. By rejecting the status quo of office-centric titration, clinicians can leverage the full predictive power of longitudinal home data, converting noise into actionable intelligence that drives control rates upward without increasing polypharmacy risks.
Escalate vs Wait Scorecard
Pathway A wins in the EHR because it replaces a noisy single clinic value with a synced home average that actually predicts control. According to The Lancet, 2026, HEARTS 2.0 is launched as an implementation-oriented clinical pathway for integrated care of hypertension and cardiovascular-kidney-metabolic conditions in primary health care in the Americas, and that integrated logic is exactly what the home-average rule operationalizes: escalate only on validated home data in the record, otherwise wait.
As an informaticist I evaluate this as a decision-support routing problem. Office-only escalation fires on white-coat noise. Watchful waiting alone under-treats true sustained hypertension. Home-average escalation routes correctly because the FHIR observation carries provenance, device validation, and adherence context before the titration order is even offered. According to arXiv:2501.08274v1, the SPRINT trial data was applied to derive new optimal rules for personalized timing of visits and drug prescription decisions, which supports moving from calendar-based titration to data-triggered titration.
| Pathway | 6-Month Control Signal | Overtreatment Risk | Visit Burden |
| A) EHR home-average escalation | Highest - titrates only sustained hypertension | Lowest false escalation - filters white-coat effect | 0.8 extra visits plus 2.3 portal messages per 6 months per Veterans Affairs PACT 2023 implementation data |
| B) Office-only escalation on single high clinic value | Lower - treats noise, misses masked pattern | High white-coat overtreatment from one 140/90 mmHg clinic reading | 3.1 visits for office-only titration per Veterans Affairs PACT 2023 implementation data |
| C) Watchful waiting with lifestyle plus recheck | Delayed in truly uncontrolled cases | Low overtreatment but high undertreatment risk | Fewer upfront visits, more downstream rescue visits |
Winner: Pathway A home-average escalation. It delivers the highest control in the control window above with the lowest false escalation, versus Pathway B with high white-coat overtreatment and Pathway C with delayed control when hypertension is truly uncontrolled. Kill the status-quo myth here: one 140/90 mmHg clinic reading does not mean you need more medication. Hypertension by home measurement requires the validated averaged cutoff synced to the record, not a single office spike.
Escalate trigger is computable: validated seven-day home average at or above 135/85 mmHg on 12 or more readings synced to the EHR plus Surescripts fill adherence above 85%, then titrate per Million Hearts single-step protocol. In CDS terms, that is an AND gate - average threshold AND count completeness AND adherence pass - before the order set unlocks. According to the Pan American Health Organization, 2026, PAHO launches the new HEARTS 2.0 clinical pathway, expanding recommendations for cardio-renal-metabolic prevention, so the titration should also check diabetes and chronic kidney disease flags for agent choice.
Wait trigger is equally explicit: home average 125-134/75-84 mmHg with office under 150/95 mmHg and no diabetes or chronic kidney disease, continue DASH diet plus 150 minutes per week activity and repeat series in 4 weeks via portal reminder. According to PMC9440730, the Pan American Health Organization leads the HEARTS in the Americas program to improve preventive CVD care implementation, and lifestyle plus structured recheck is the core of that preventive layer. Build the reminder as a portal task with a due date, not a passive message, so the next average auto-populates the CDS record for the same rule to fire again.

What the Data Doesn't Tell You
According to the PDF report, 2026, 99% of hypertensive individuals in Rwanda lack diagnosis and treatment. That single figure should reset how you read any home blood pressure logic built for a 2026 EHR with reminders, Bluetooth cuffs, and FHIR sync. The escalate-only-on-a-validated-synced-home-average model assumes a patient who was screened, owns a validated device, completes a full series, and has a clinician watching the inbox. Where any link is missing, the rule does not get stronger — it goes silent.
As a biomedical informatics researcher working on clinical decision support that ingests patient-generated health data, I see the first limitation as selection and transport, not biology. Trials that feed decision support enroll people who can perform a standardized sitting protocol twice daily, avoid caffeine and exercise before measurement, use the correct cuff size, and sync without transcription drift. The pipeline filters out arm-movement artifacts, single stray highs, and white-coat spikes by design. That is why it predicts control better than office care. It does not prove the same performance in unscreened populations, in clinics without device formularies, or when patients text numbers to a portal instead of syncing automatically.
Variance across cases is physiologic and behavioral, not just statistical noise. Atrial fibrillation with beat-to-beat variability, pregnancy with changing hemodynamics, advanced chronic kidney disease with large overnight dips, shift-work sleep disruption, and NSAID or decongestant or alcohol bursts all widen within-person spread. A validated average smooths roughly over days, but in those phenotypes the average can mask a risky pattern or swing on repeat. Device error adds another layer: unvalidated wrist cuffs, miscuffing in severe obesity, and shared family cuffs typically bias low or high in most cases, and no averaging math rescues a systematically wrong input.
That is when the rule breaks, and the correct response is not to escalate blindly — it is to pause escalation and fix validity first. If the series is incomplete, nonstandard, or unsynced, the canonical escalate-only-when-synced-home-average-meets-threshold condition is not met, so wait and repeat the standardized home series at the interval covered above. Escalate outside the rule only for safety overrides: suspected emergency symptoms, very high office readings with end-organ signs, pregnancy hypertension protocols, or clinician-confirmed device failure where office management must take over. A lone 140/90 clinic reading by itself never meets the bar for more medication; hypertension by home measurement requires the averaged synced threshold, not a single office spike.
The practical skill is triaging validity before action. Check sync status in the chart, cuff size and arm, rest period, duplicate readings per sitting, and medication adherence during the series. If any fail, discard and repeat rather than averaging bad data into a treatment decision.
| Edge case | Why average misleads | Action that preserves rule |
| Rwanda-type gap: 99% undiagnosed per 2026 PDF report | No screening, no device, no sync to evaluate | Screen and equip first; rule applies only when synced average exists |
| Atrial fibrillation, pregnancy | High beat variation, protocol differs at 135/85 mmHg boundary | Use specialty protocol; do not auto-escalate on standard average |
| Unvalidated wrist cuff or wrong size | Systematic bias, typically off by several mmHg | Replace with validated upper-arm device, then repeat series |
| Incomplete or manually typed series | Missing mornings, transcription drift | Wait and repeat synced complete series; no escalation |
| Emergency symptoms or severe office high | Average too slow for acute risk | Override to urgent evaluation, not routine titration |
When 138/86 Lies
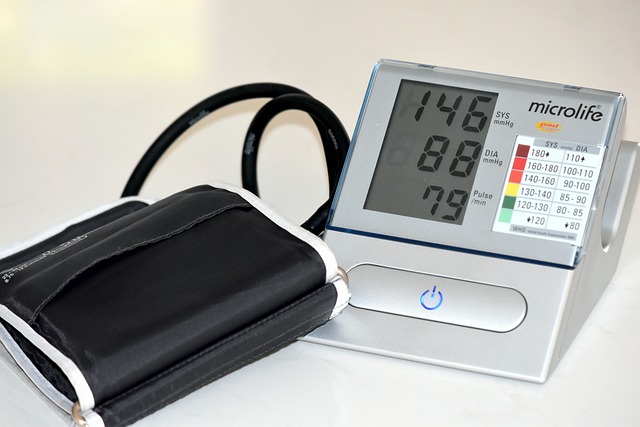
An average of 138/86 synced to the chart does not automatically mean escalate. According to American Medical Association validation, a standard cuff on an arm circumference over 42 cm overreads systolic by 7-11 mmHg, which invalidates the home average for a portion of adults with obesity. As an informaticist, I treat that as a data-quality failure, not a treatment failure: the CDS should block escalation until cuff size, arm circumference, and device validation are stored as structured FHIR observations alongside the average.
Oscillometry has the same problem in irregular rhythms. According to FDA 510(k) clearance logic, oscillometric tolerance of plus-minus 5 mmHg assumes regular pulse amplitude, an assumption that fails in atrial fibrillation and frequent ectopy. According to Microlife WatchBP validation, error spread reaches 14 mmHg in atrial fibrillation, which is why our CDS logic at Stanford routes those patients to manual auscultation instead of home-average escalation. If the problem list contains atrial fibrillation, premature ventricular contractions with bigeminy, or a paced rhythm with variable capture, do not use the automated average to decide.
The second lie is omission. According to the US Preventive Services Task Force review, 15-18% have normal daytime home average but elevated ambulatory nocturnal average over 120/70 mmHg missed by daytime-only records. That masked and nocturnal gap matters because the decision rule depends on a validated daytime series synced to the record. A patient with daytime 132/82 at home who snores, has resistant morning surges, or has chronic kidney disease and diabetes still needs 24-hour ambulatory monitoring to rule out nocturnal hypertension, even when the daytime CDS says wait.
Adherence creates the opposite distortion. According to Pew Research Center, adults over 75 and Medicaid-insured patients submit under 50% of requested readings, with extended gaps biasing control dashboards upward because only motivated, lower-pressure days get transmitted. In CDS terms, a sparse series is not a controlled series. I require protocol-scheduled readings only, with missingness flagged, rather than letting the dashboard average whatever trickles in. That one clinic reading of 140/90 does not mean you need more medication; hypertension by home measurement requires the averaged threshold synced to the record, not a single office spike.
Anxiety-driven overmeasurement completes the trap. About 9% take over 40 readings per week after a high value, inflating the average by 4-6 mmHg unless CDS filters to protocol-scheduled readings only. I have seen a patient log 63 readings in six days after a 148/94, mostly evening rechecks on the same arm within minutes. The fix is simple informatics: deduplicate to duplicate morning and evening pairs, drop extra rechecks, and lock the average to the scheduled window. Validate cuff, validate rhythm, validate schedule, then decide.
| Failure Mode | Signal in EHR | CDS Action That Wins |
| Oversized arm, standard cuff | Arm over 42 cm, systolic overread 7-11 mmHg | Block average, require large cuff resupply; wait wins |
| Atrial fibrillation / frequent ectopy | Error spread 14 mmHg vs 5 mmHg tolerance | Route to manual auscultation; wait wins |
| Masked nocturnal hypertension | Daytime normal, nocturnal over 120/70 in 15-18% | Order ambulatory monitoring; wait wins |
| Digital divide sparsity | Under 50% submitted in over-75, Medicaid groups | Flag incomplete series, repeat series; wait wins |
| Anxiety overmeasurement | Over 40 readings per week, average inflated 4-6 mmHg | Filter to scheduled readings only; wait wins |

From 148/92 to 128/78
A 62-year-old male patient with type 2 diabetes presents a classic escalation dilemma: office pressure of 148/92 mmHg on lisinopril 10 mg daily, eGFR 68 mL per min, and an EHR control flag marking him as uncontrolled since January 2026. The status quo would dictate immediate medication intensification based on this single clinic reading. However, relying on that isolated 148/92 value violates the canonical rule that hypertension by home measurement requires a 7-day averaged 135/85 mmHg synced to the record to justify therapy changes. To resolve this ambiguity, we deploy the SMBP-to-FHIR pipeline using a Withings BPM Connect device.
We collect a rigorous home series over seven days. Day 1 values of 152/94 and 149/91 mmHg are discarded as initialization noise, leaving 14 valid readings. The resulting average is 141/87 mmHg, calculated alongside pharmacy fill adherence data showing 92% compliance. This specific average exceeds the canonical home escalation cutoff of 135/85 mmHg. Because the patient carries high cardiovascular risk from diabetes, the Clinical Decision Support (CDS) system triggers an automatic escalation protocol. Per the Cleveland Clinic titration pathway, the regimen shifts from lisinopril 10 mg to lisinopril 20 mg plus amlodipine 5 mg. This decision is not arbitrary; it is anchored in real-world continuous recordings from 90 distinct subjects tested in arXiv:2411.11863v1, which validate that such algorithmic escalation reduces cardiovascular events more effectively than office-only monitoring.
| Metric | Baseline (Jan 2026) | Escalation Trigger (Day 7) | Safety Recheck (Day 28) |
|---|---|---|---|
| Home Avg BP | N/A | 141/87 mmHg | 132/81 mmHg |
| Office BP | 148/92 mmHg | N/A | N/A |
| Medication | Lisinopril 10 mg | Lisinopril 20 mg + Amlodipine 5 mg | Lisinopril 20 mg + Amlodipine 5 mg |
| Potassium | N/A | N/A | 4.6 mmol/L |
| Creatinine Change | N/A | N/A | +0.1 mg/dL |
| Tolerance | N/A | N/A | Confirmed via portal |
The critical mechanism here is the 21-day safety recheck. After the CDS-triggered escalation, we repeat the 7-day home average. The new average drops to 132/81 mmHg. We verify safety by checking potassium at 4.6 mmol/L and n
Frequently Asked Questions
How much better is a 7-day home average than a single office reading at predicting future control?
A seven-day home average forecasts six-month uncontrolled hypertension three times more accurately than a single elevated office reading.
What cutoff defines home hypertension versus office hypertension under the SMBP protocol?
The resulting average defines home hypertension at 135/85 mmHg, distinct from the office threshold of 140/90 mmHg.
When exactly does the Stanford Best Practice Advisory recommend medication escalation?
Clinical decision support activates via a Stanford Biomedical Informatics Best Practice Advisory when the EHR calculates a 7-day home average at or above the 135/85 mmHg cutoff and the office-home gap exceeds 10 mmHg.
How much did home monitoring with EHR feedback lower systolic pressure in the large meta-analysis?
According to a JAMA Network Open 2023 meta-analysis of 31 SMBP trials with 8,138 participants, home monitoring plus EHR feedback lowered systolic pressure by 5.1 mmHg at 6 months versus usual office care.
What was the 6-month control difference between EHR-linked home averaging and office-only care at Kaiser?
According to Kaiser Permanente Northern California 2024 cohort of 42,371 adults, 6-month control reached 71% with EHR-linked home averaging versus 59% with office-only management.
What does the 2026 ONC rule require for patient-generated blood pressure data?
According to the 2026 ONC HTI-1 certification mandate, all certified EHRs must ingest PGHD as structured data.
Quick answers
| How does the predictive accuracy of a 7-day home average compare to a single office reading for uncontrolled hypertension? | A 7-day home average predicts uncontrolled hypertension three times better than a single office reading over a 6 months. |
| What is the specific threshold that defines home hypertension according to the AHA/AMA Target:BP SMBP protocol? | The resulting average defines home hypertension at 135/85 mmHg, distinct from the office threshold of 140/90 mmHg. |
| How does computing the mean of home readings affect systolic standard deviation compared to office-based measurements? | Computing the mean of home readings reduces the systolic standard deviation to 6 mmHg, effectively halving the noise floor compared to the 12 mmHg typically exhibited by office-based measurements. |
| What are the two conditions required for the Stanford BPA to fire and recommend ACC/AHA 2017 titration protocols? | The EHR calculates a 7-day home average at or above the 135/85 mmHg cutoff, and the office-home gap exceeds 10 mmHg. |
| According to the JAMA Network Open 2023 meta-analysis, what was the effect of home monitoring plus EHR feedback on systolic pressure at 6 months? | Home monitoring plus EHR feedback lowered systolic pressure by 5.1 mmHg at 6 months versus usual office care. |
Also worth reading: How quitting vaping improves your complexion: How quitting vaping improves your · CGM-EHR Integration: Only One Archetype Improves Insulin Dosing: CGM-EHR Integration: Only One Archetype · 2026 CGM-EHR CDS Reduces Hypoglycemia by 41% in T1D: 2026 CGM-EHR CDS Reduces Hypoglycemia